
Charlestown Housing Density Compared To All Other RI Towns
Rhode Island is the smallest U.S. state by land area, and the second most densely populated state, exceeded in density of development only by New Jersey. Rhode Island’s 39 cities and towns range in housing density from 36 dwelling units per square mile in rural Foster to 6,826 in urban Central Falls.
Charlestown, at 160 dwelling units per square mile, is the most densely populated rural town in the state and the most densely populated community that lacks a connection to a sewerage treatment plant. In addition, Charlestown does not have public water.
Between 1970 and 2020, Rhode Island’s population grew from 946,725 to 1,097,379 – a 15.9% increase in population. In those same decades, Charlestown’s population grew from 2,863 to 7,997 – a 179% increase.
Charlestown’s year-round population has nearly tripled in a period when the state, as a whole, has had negligible growth. We have grown more than 11 times faster than the state. Charlestown’s census numbers, however, underestimate our population growth by not considering the large number of dwelling units occupied by non-residents or used for short-term tourist rentals; the occupants of these units are not counted in the census.
In the next 25 years, Rhode Island’s population is expected to decrease by over 5%. Charlestown’s population may decrease as well, as year-round homes continue to transition to second homes. But forced by state mandates, the number of dwelling units in Charlestown will continue to grow.
For a town like Charlestown that depends on individual wells and septic systems, what matters is not the number of people the census counts, but how many total dwelling units there are discharging waste into our groundwater.
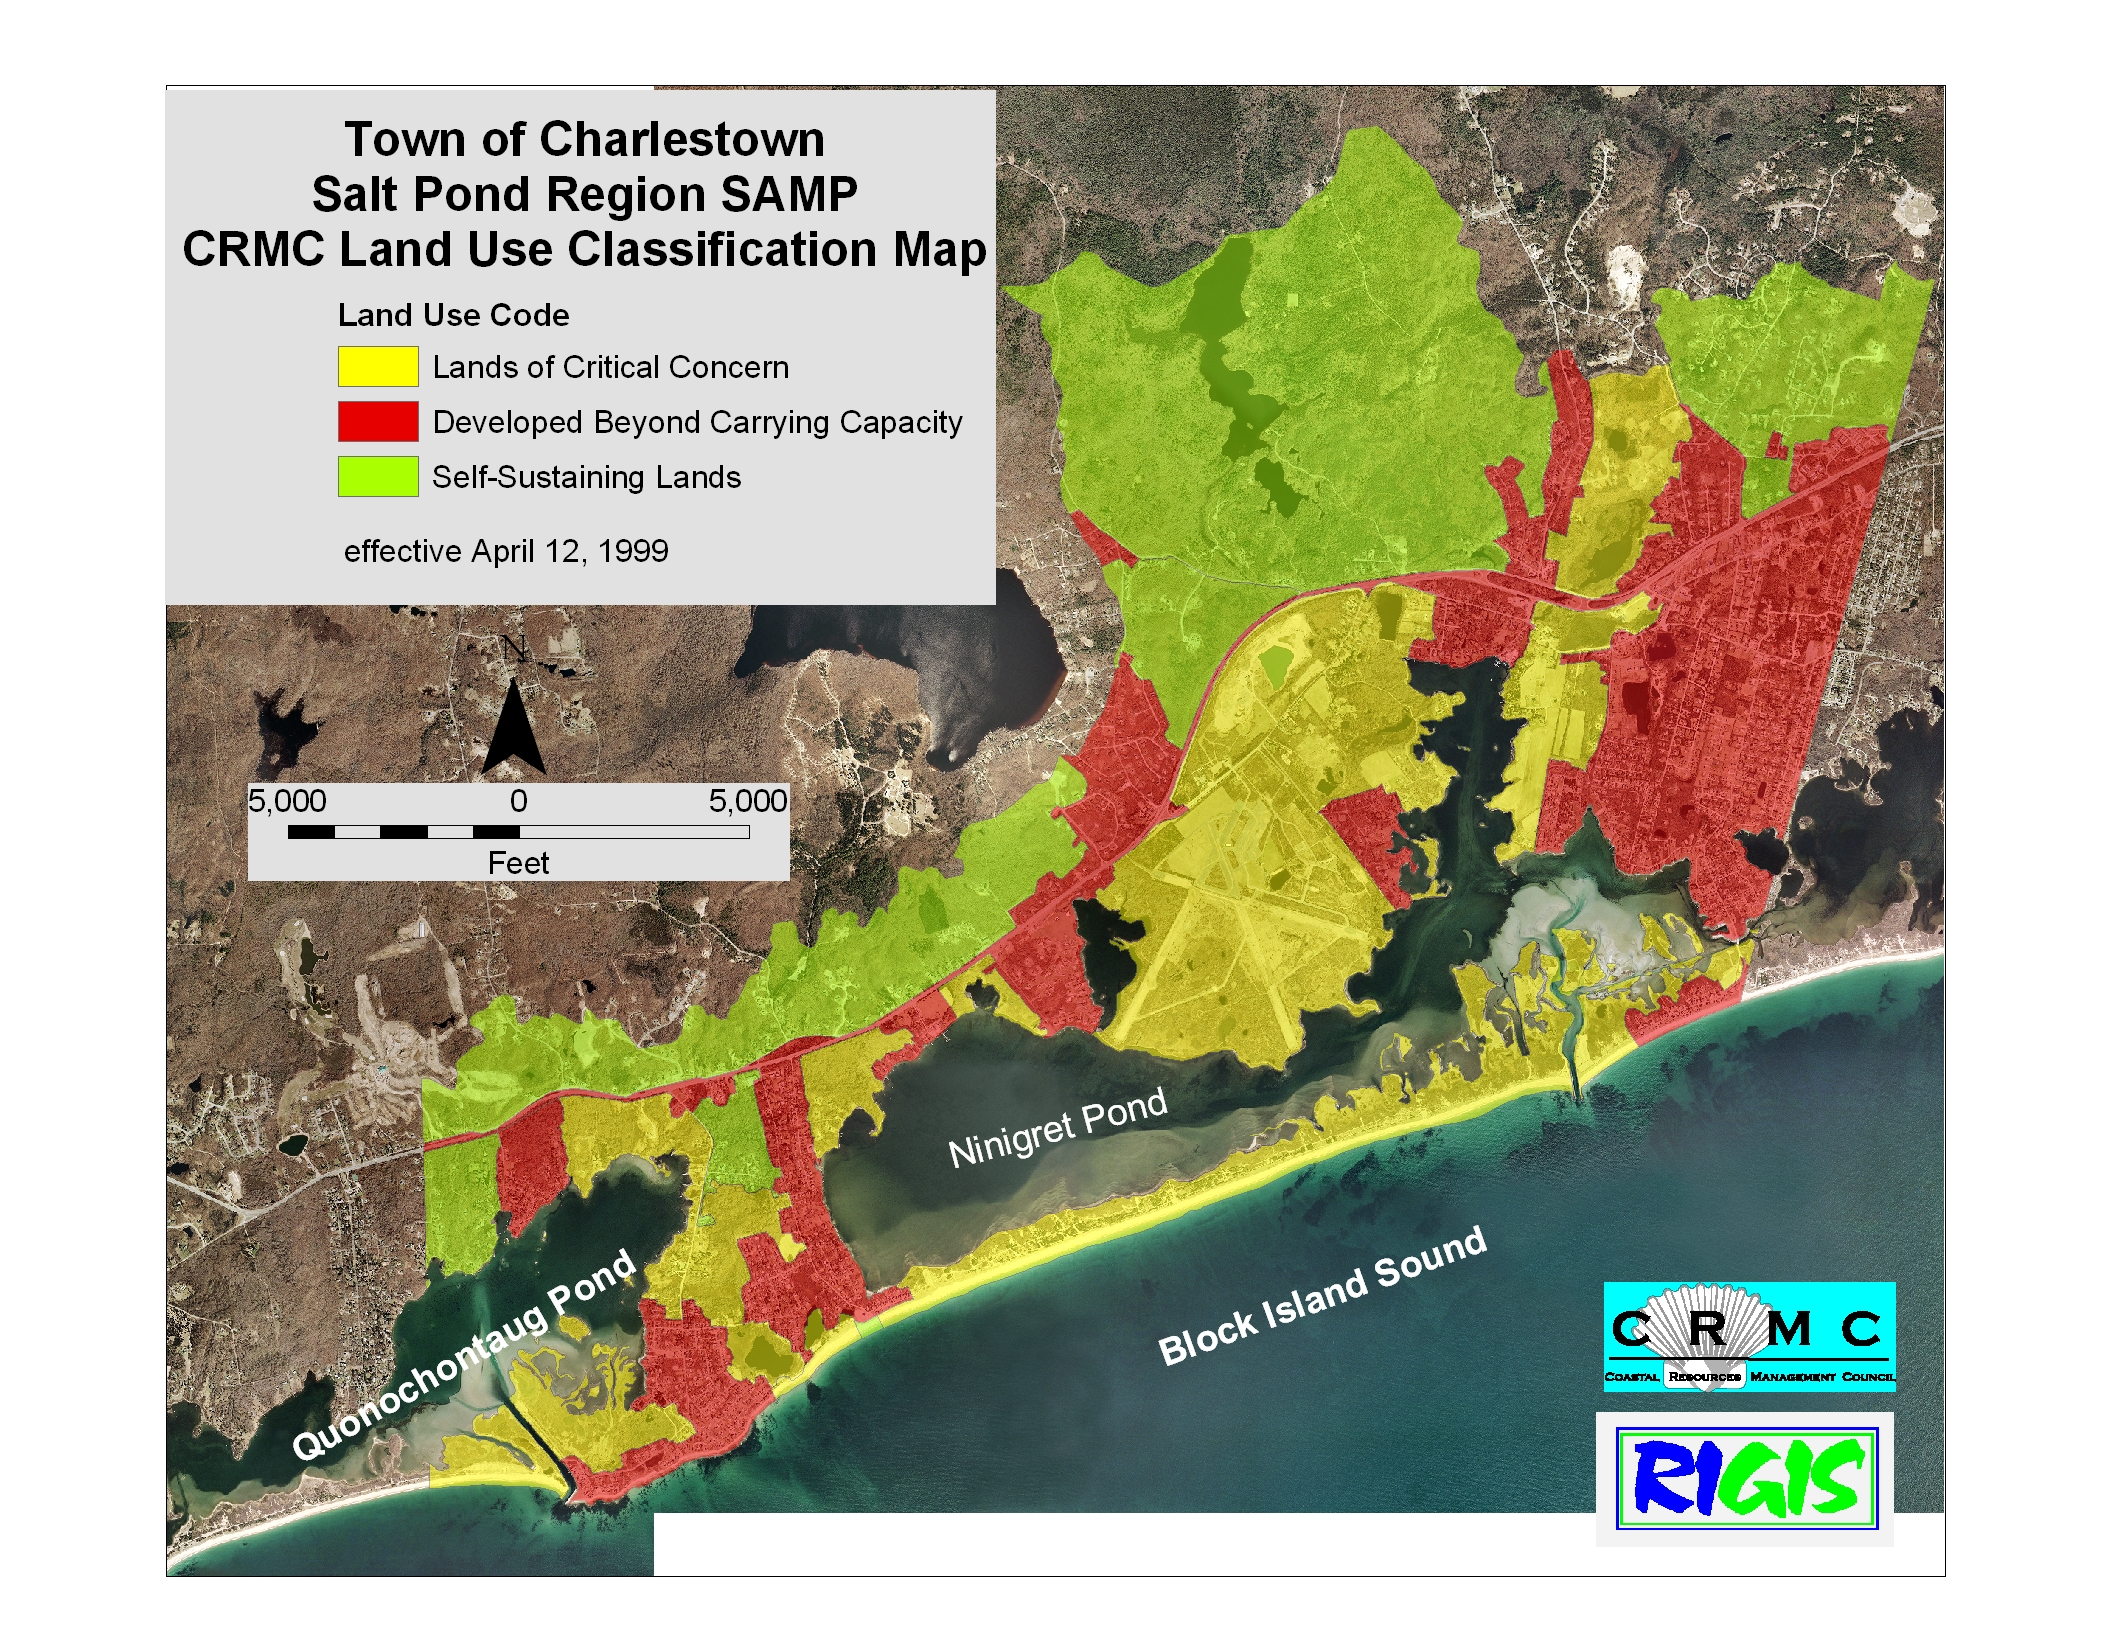
There are limits to growth. In fact there are large areas both north and south of Route 1 that the Coastal Resource Management Council (CRMC) has already designated as “Developed Beyond Carrying Capacity.” Despite the designation, both CRMC and the RI Department of Environmental Management continue to permit more new dwelling units in these areas.
Charlestown’s zoning, along with over twenty years of commitment to expanding land preservation, was designed to protect our groundwater. The state legislature has overruled our zoning, and the local land conservation effort is now greatly diminished.
Many towns, including Charlestown, are now asking that the state return control over land use, zoning, and planning to the municipalities. That alone won’t guarantee protection of our groundwater, but without local control, our clean drinking water will continue to be threatened.
Municipalities Ranked By Dwelling Units Per Square Mile
| Municipality | Current Housing Units | Land Area in Square Miles | Density - Dwelling Units Per Square Mile | Sewage Treatment Plant |
|---|---|---|---|---|
| Foster | 1836 | 50.80 | 36 | No |
| Exeter | 2647 | 57.47 | 46 | No |
| West Greenwich | 2575 | 50.26 | 51 | No |
| Glocester | 4213 | 54.18 | 78 | No |
| Richmond | 3173 | 40.29 | 79 | No |
| Hopkinton | 3613 | 42.95 | 84 | No |
| Scituate | 4263 | 48.16 | 89 | No |
| Little Compton | 2414 | 20.52 | 118 | No |
| Burrillville | 6701 | 55.03 | 122 | Yes - part of town |
| Charlestown | 5381 | 33.60 | 160 | No |
| New Shoreham | 1818 | 9.08 | 200 | Yes - part of town |
| North Smithfield | 5358 | 23.80 | 225 | Yes - part of town |
| South Kingstown | 13771 | 56.45 | 244 | Yes - part of town |
| Coventry | 14931 | 59.05 | 253 | Yes - part of town |
| Tiverton | 7781 | 29.05 | 268 | Yes - part of town |
| North Kingstown | 12189 | 43.14 | 283 | Yes - part of town |
| Smithfield | 8012 | 26.31 | 305 | Yes |
| Jamestown | 3122 | 9.45 | 330 | Yes - serves half of dwellings |
| East Greenwich | 5539 | 16.39 | 338 | Yes - serves two thirds of dwellings |
| Portsmouth | 8610 | 22.98 | 375 | No - ? |
| Westerly | 13245 | 29.52 | 449 | Yes - serves half of dwellings |
| Lincoln | 9525 | 18.12 | 526 | Yes |
| Johnston | 12501 | 23.43 | 534 | Yes |
| Cumberland | 15017 | 26.45 | 568 | Yes |
| Middletown | 8029 | 12.72 | 631 | Yes - most of town |
| Narragansett | 9857 | 13.89 | 710 | Yes - most of town |
| Barrington | 6380 | 8.22 | 776 | Yes |
| Warren | 5495 | 6.12 | 898 | Yes - most of town |
| Bristol | 9629 | 9.82 | 981 | Yes - most of town |
| Warwick | 38625 | 35.04 | 1102 | Yes - most of town |
| Cranston | 34182 | 28.34 | 1206 | Yes - most of town |
| East Providence | 22196 | 13.24 | 1676 | Yes |
| Newport | 13466 | 7.67 | 1756 | Yes |
| West Warwick | 14414 | 7.79 | 1850 | Yes |
| Woonsocket | 19754 | 7.74 | 2552 | Yes |
| North Providence | 15932 | 5.62 | 2835 | Yes |
| Pawtucket | 33832 | 8.70 | 3889 | Yes |
| Providence | 75257 | 18.40 | 4090 | Yes |
| Central Falls | 8191 | 1.20 | 6826 | Yes |

You can learn more about the author, Ruth Platner, at her profile page.
The banner image is a part of Charlestown’s zoning map showing some of Charlestown’s densest neighborhoods.
April 21, 2026 @ 6:00 pm
thank you for posting
April 21, 2026 @ 12:04 pm
As always Ruth great presentation of our towns current situation. Ruth, I assume that Ms Spears and Ms. Gu were vocal opponents to the legislation which passed last year and that they are working to rectifying that legislation? I should know the answer to that question but unfortunately I don’t.
The idea that growth can go on indefinitely if done right is a huge mistake. Environmental perturbation resulting from nutrient enrichment or groundwater pollution are extremely expensive or near impossible to remedy once the damage has been done. It’s a reason that so many of our waters don’t meet water quality standards so many years after pollution sources and problem areas have been identified. Keep up the great work. Thank you.
April 21, 2026 @ 11:44 am
Given the CRMC and the RI Department of Environmental Management continue to permit more new dwelling units in areas already designated as “Developed Beyond Carrying Capacity”, is there an avenue for the Federal government to step in?